

Custom Reports Module
The Custom Reports module is the central location for creating, running, and maintaining your custom report queries.
Accessing Custom Reports
Custom Reports lives at Admin › Developer › Custom Reports. Access is permission-gated — users need reporting access granted by their role.
Module Overview
The Custom Reports module consists of several panels of tools to assist you when working with your custom queries and reports.
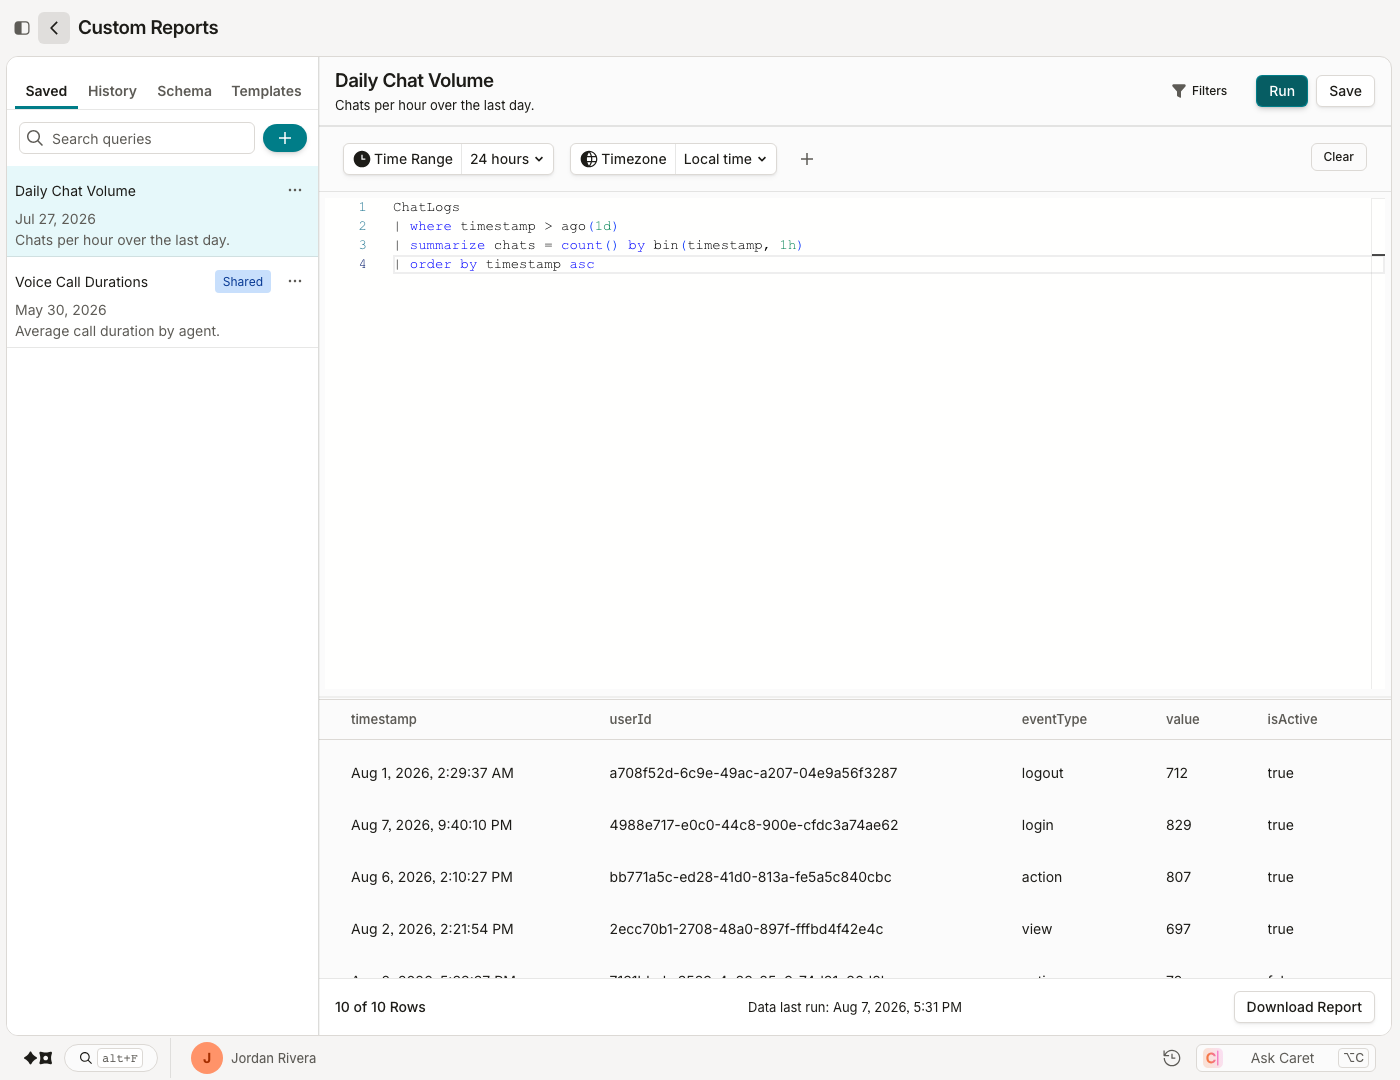
Left-Hand Panel
The left-hand panel contains a set of tools that will come in handy when working with custom report queries. Let's examine these tabs one by one.
Saved
The Saved tab displays all of your saved queries, as well as any saved queries that have been shared by your teammates.
You can search your saved queries by typing into the search box, and the list will filter down according to your search terms as you type, matching on both the query name and query text.
The queries displayed show the query name and description, and a "Shared" indicator if the query has been shared with the organization.
Select a query in the list to open it in the editor and run it.
To remove a query or toggle team-sharing, click the ellipses to the right of the query. These options are only available for queries that you have created.
Shared queriesShared queries are available to all users in the organization with access to the custom reports module. When you share a query, others are able to run the query or save a copy, but only the original author is able to update the shared query.
History
The History tab displays all of the queries that you have run in the Custom Reports module.
As on the Saved tab, you can search your query history by typing into the search box, and the history filters as you type.
The queries listed show the name of the query, when it was run, a preview of the first couple lines of the query, and the number of rows returned. Clicking on a history item brings the query back into the query editor so that it can be re-run or saved.
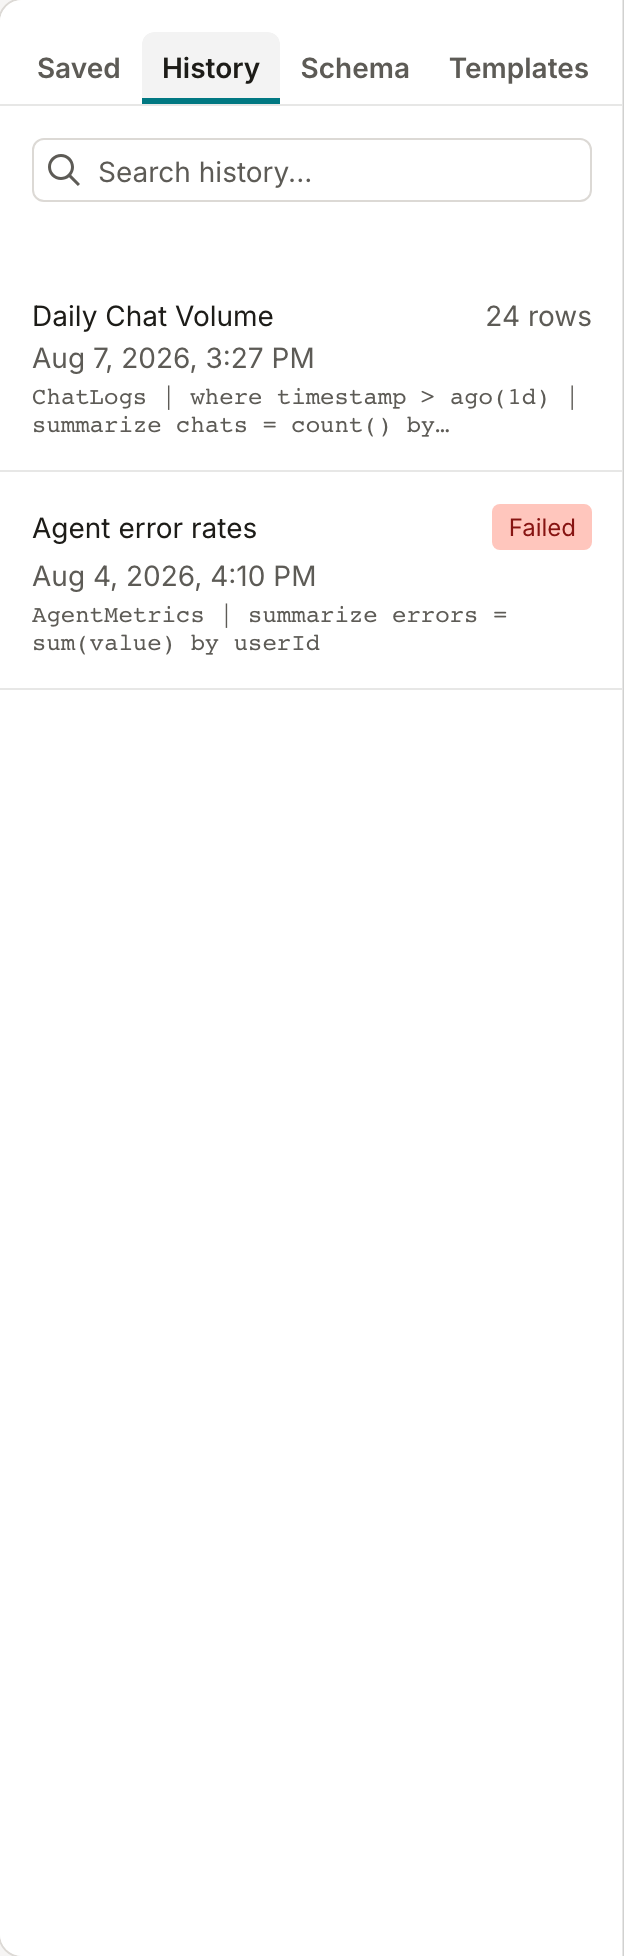
Query history to the rescueEvery query that you run, whether it's a saved query or an ad-hoc query that you ran but never saved, is saved to your query history. This can be helpful if you accidentally leave the custom reports screen before saving your work, or you need to re-run a query from the other day that you never saved.
Schema
The Schema tab contains a list of tables and their columns that are available to query in Custom Reports.
The tables are expandable to display the columns and their datatypes, and as with the other tabs, the Schema tab is searchable.
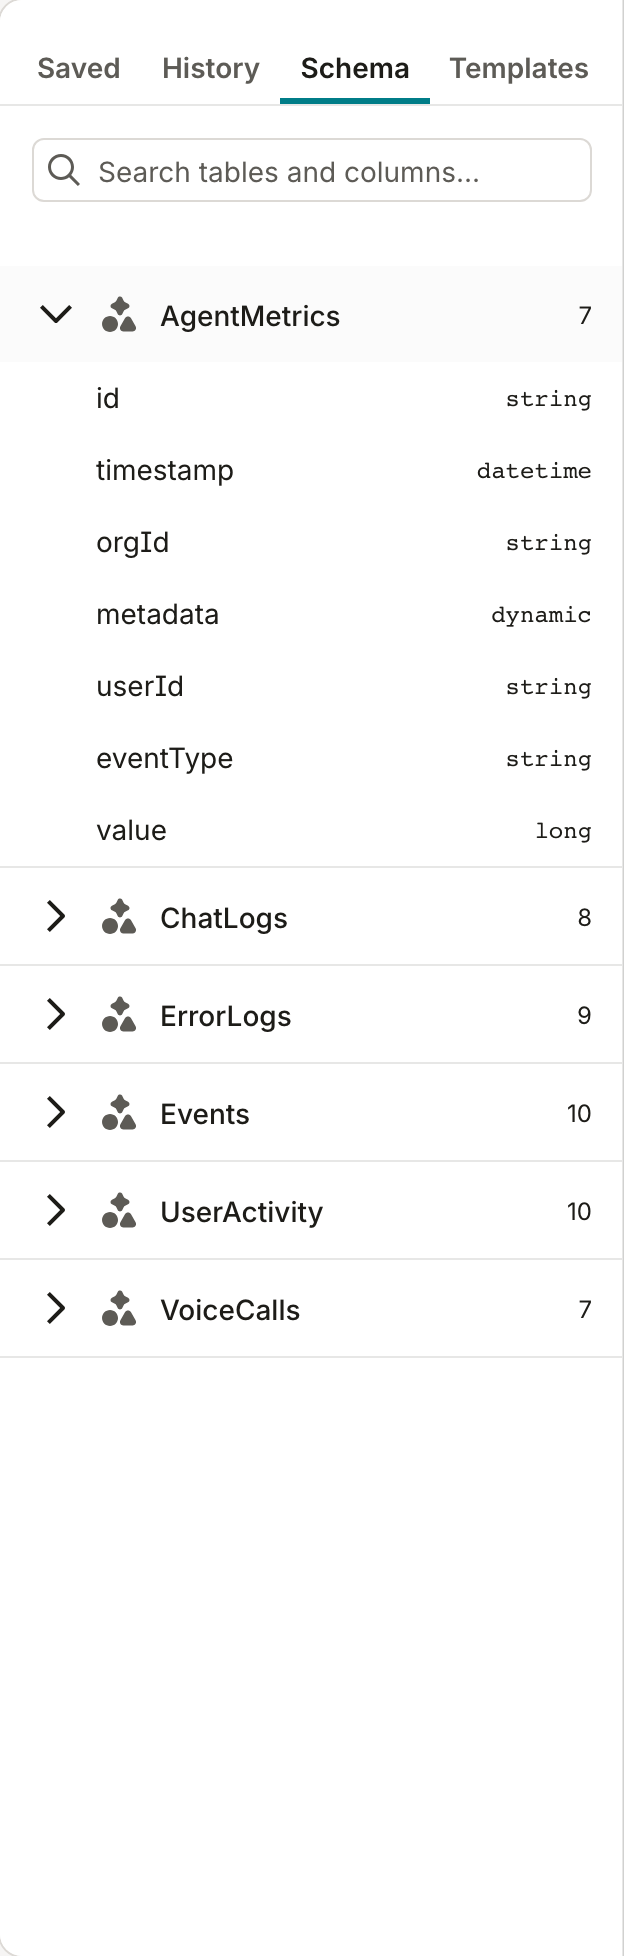
Check out the Reporting Data Model for a more descriptive listing of the tables and fields available to query.
Templates
The Templates tab contains platform-provided queries that answer common questions and demonstrate some of the different kinds of queries that can be run in custom reports.
As with the other tabs, templates are searchable, and they can be selected and run in the editor — modify one and save it as your own query.
New Query
To start a new query, click the + button at the top of the Saved tab.
Top Panel
The top panel of the screen allows you to control some high-level settings for your query.
Click on the title and description fields and start typing to set a name and description for your query. These will be saved with your query if you choose to save it, and displayed on the History tab even if you don't.
In the middle of the top panel are two dropdowns that control aspects of query execution:
- The first holds timeframes representing how far back in time the query will go when considering what data to query. It effectively sandboxes the query to a specific timeframe of data (30 minutes, 1 hour, 12 hours, 24 hours, 48 hours, 3 days, 7 days, or a Custom timeframe).
- The second has the values "Local Time" and "UTC", and it controls how datetime values are handled in evaluating your query. It also controls whether datetimes in your query's result set are returned in your local time or UTC.
Using a custom time rangeSelecting Custom allows you to select a start and end date for the query window.
To the right of the top panel are the Save and Run buttons. Both do what they say. In some cases, the "Save" button will say "Save Copy" if you don't have permission to update the query you're viewing (for example, a shared query someone else created, or a template).

Query Editor
The query editor is where you build your KQL queries.
The editor offers context-aware assistance as you type, suggesting tables, fields, and KQL functions based on its knowledge of the schema — click the information icon on a suggestion to read more about a particular function. It also identifies and highlights errors in your query, underlining problems with a red squiggly line; hover over an error to see its description.
You can read more about writing KQL queries in the Writing Queries section.
Results Panel
Once you've written your query and clicked Run, the results panel displays the query results in table format. Each column can be sorted by clicking on the column heading, and resized by dragging the column heading separator.
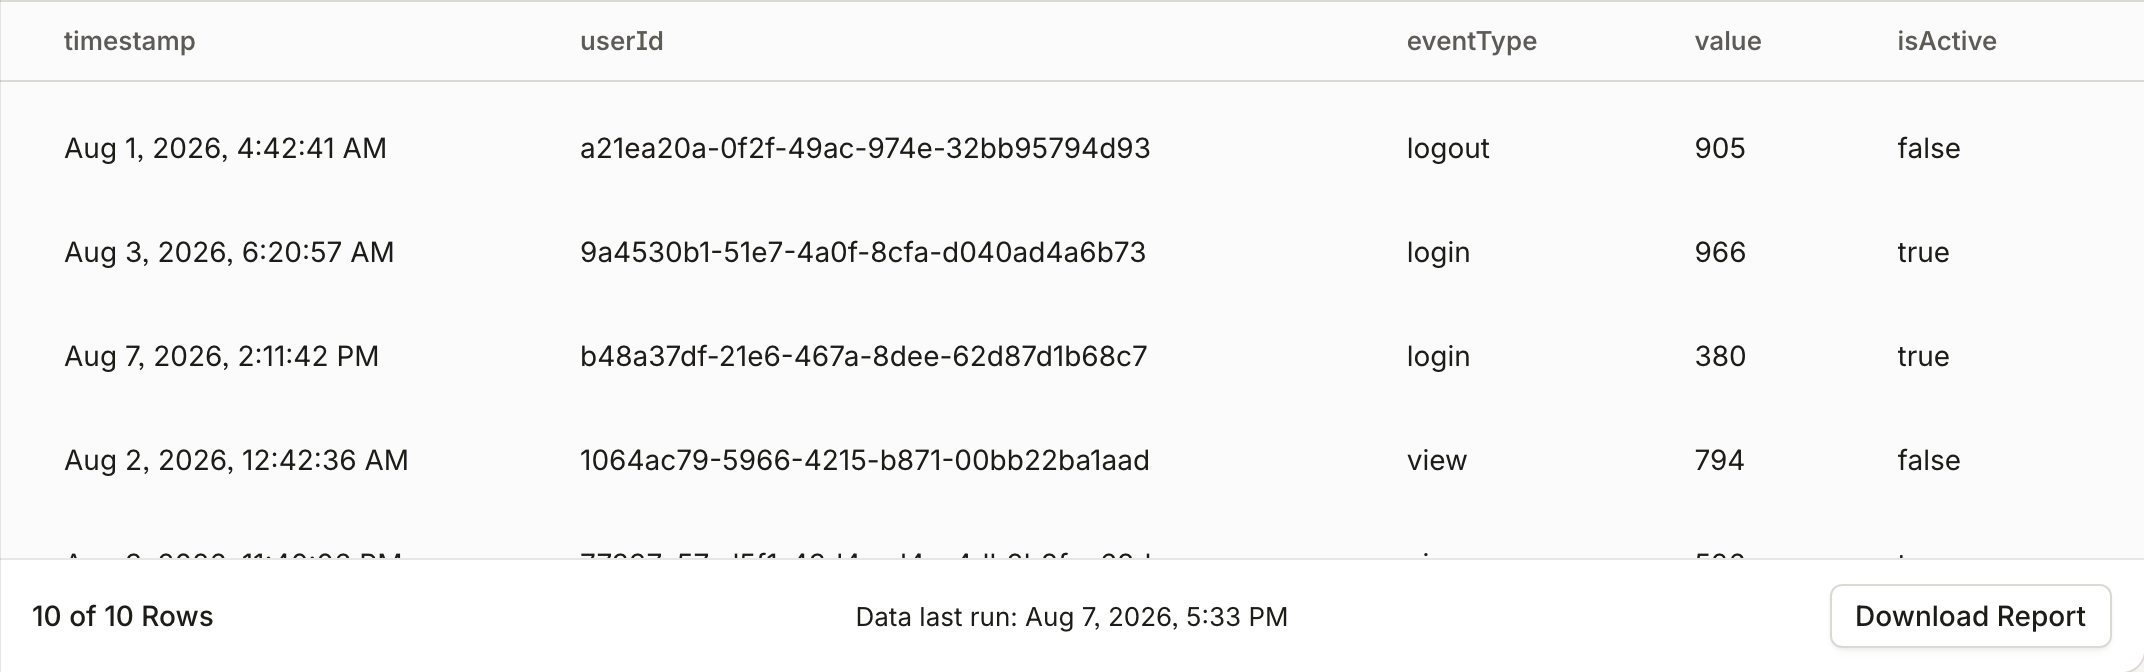
The footer displays the number of rows returned and the run date.
Export Query Results
The query results can be downloaded as a comma-separated values (.csv) file or as an Excel spreadsheet (.xlsx) by clicking the Download Report button.
Updated about 2 months ago